

Join Our Telegram channel to stay up to date on breaking news coverage
The Bitcoin price rose over 2% in the past 24 hours to trade at $112,045 as of 3:38 a.m. EST as Figma said its $91 million BTC buy is not a Michael Strategy move and Sora Ventures said it will build Asia’s first $1 billion Bitcoin treasury firm outside of Japan.
Figma, a collaborative design software company, expanded its BTC hoard to $91 million in the second quarter of this year, according to Chief Financial Officer Praveer Melwani.
“We’re not trying to be Michael Saylor here,” CEO Dylan Field told CNBC, adding that it’s a part of the company’s $1.6 billion cash position.
This stance comes as Figma’s approach appears more conservative, in contrast to some firms that have turned to BTC holdings as a last-ditch effort to excite investors.
“This is not, like, a Bitcoin holding company. It’s a design company, but I think there’s a place for it in the balance sheet and as part of a diversified treasury strategy,” Field added.
Michael Saylor’s Bitcoin strategy centers on utilizing Strategy’s balance sheet and debt financing to acquire Bitcoin as a primary treasury reserve asset continuously.
Saylor announced on Sept. 2 that Strategy had bought an additional 4,048 BTC for $449.3 million at an average price of $110,981 per BTC.
Strategy has acquired 4,048 BTC for ~$449.3 million at ~$110,981 per bitcoin and has achieved BTC Yield of 25.7% YTD 2025. As of 9/1/2025, we hodl 636,505 $BTC acquired for ~$46.95 billion at ~$73,765 per bitcoin. $MSTR $STRC $STRK $STRF $STRD https://t.co/dxXWygUijS
— Michael Saylor (@saylor) September 2, 2025
The acquisition brought Strategy’s total BTC holdings to 636,505 BTC.
With the Figma holdings now surging, corporate Bitcoin treasury adoption has reached 1 million BTC, with more companies touting the king of crypto’s potential to bolster their balance sheets, according to data from BitcoinTreasuries.net.
BREAKING: Total #Bitcoin held by publicly traded companies globally just passed 1,000,000 BTC.
Nearly 5% of all the BTC that will ever be 🔥 pic.twitter.com/LVGGYbGBfQ
— BitcoinTreasuries.NET (@BTCtreasuries) September 4, 2025
This comes as spot BTC exchange-traded funds (ETFs) continue to soar, with total market capitalization climbing to over $152 billion, according to Coinglass data.
Sora Ventures Unveils Asia’s First $1B Bitcoin Treasury
With BTC treasuries adding to their hoard, Sora Ventures introduced Asia’s first $1 billion Bitcoin Treasury Fund at Taipei Blockchain Week.
The firm will start with $200 million in commitments, with the plan to purchase $1 billion within six months and the aim to promote and grow corporate BTC treasury strategies already used by companies like Metaplanet, Moon Inc., and BitPlanet.
JUST IN🇹🇼🇺🇲🔥 Taiwan’s TSMC plans to invest $1 billion in Sora Ventures to launch Asia’s first #Bitcoin treasury with US, Chinese and European funds.
🚨 Sora Ventures is becoming Asia’s first ‘Microstrategy’ to raise funds and Invest in #Crypto. pic.twitter.com/dxdU1FZ5VA
— RKM (@rkmtimes) September 5, 2025
Bitcoin Price Analysis: Elliott Wave Pattern Suggests Possible Rally
The BTC/USD chart analysis on the daily timeframe shows that the BTC price continues to trade within a well-defined rising channel pattern, maintaining its long-term bullish structure.
Since June, the Bitcoin price action has followed a clear Elliott Wave pattern, with the market now appearing to be in the early stages of wave (5) after wave (4) successfully bounced from the lower boundary of the rising channel.
BTC remains just below its 50-day Simple Moving Average (SMA) at $115,230, which now serves as immediate resistance. However, the 200-day SMA (101,463) serves as the long-term support.
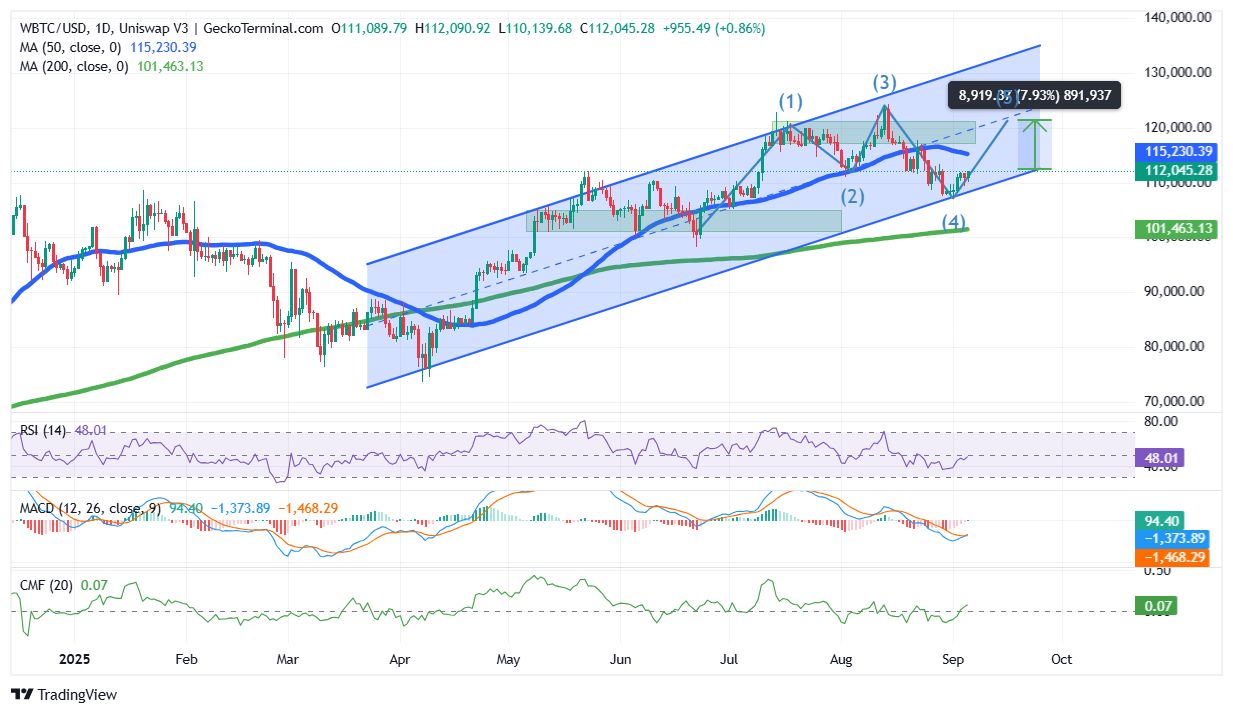
BTC Price Indicators Point Toward Growing Bullish Momentum
The Relative Strength Index (RSI) currently sits at 48, just under the neutral 50 level and moving up, suggesting that BTC is gaining momentum and has plenty of room to climb.
Meanwhile, despite the Moving Average Convergence Divergence (MACD) lines being under the zero line, the blue MACD line has crossed above the orange line, a confirmation of a bullish crossover.
The Chaikin Money Flow (CMF) has ticked up to +0.07, signaling a return of buying pressure after a period of neutral flow.
If BTC can reclaim its 50-day SMA around $115,230, it could pave the way for a push toward the $121,000 resistance, a 7.93% from the current level.
According to a crypto analyst on X, Wolf of All Streets, BTC seems to have hit another lower high.
Looks like it is putting in another lower high. pic.twitter.com/5vqJ7nOoyj
— The Wolf Of All Streets (@scottmelker) September 4, 2025
Meanwhile, data from Santiment shows BTC is forming a bullish divergence as it drops 5.9% while the S&P 500 rises 0.4% and gold gains over 5.5% since August 22. Historical patterns indicate that BTC always catches up when trailing the traditional market for sustained periods.
Another analyst, Johnny Woo, says that the price of Bitcoin could surge to a new ATH in anticipation of a Fed rate cut on September 16.
If they don’t stage another 🤡 show, we could see a new ATH in anticipation of a Fed rate cut on September 16.#Bitcoin $BTC #BTC https://t.co/o7oGkdSYmU pic.twitter.com/d9GqrjoLK8
— Johnny Woo | Never DM you for Money (@j0hnnyw00) September 5, 2025
On the downside, a slip below the $110,000 support zone would put this bullish outlook at risk, with the 200-day SMA at $101,463 being the likely support level.
Related News:
Best Wallet – Diversify Your Crypto Portfolio

- Easy to Use, Feature-Driven Crypto Wallet
- Get Early Access to Upcoming Token ICOs
- Multi-Chain, Multi-Wallet, Non-Custodial
- Now On App Store, Google Play
- Stake To Earn Native Token $BEST
- 250,000+ Monthly Active Users
Join Our Telegram channel to stay up to date on breaking news coverage