Join Our Telegram channel to stay up to date on breaking news coverage
The BNB price dropped 2% in the past 24 hours to trade at $1,292 as of 4:36 a.m. on trading volume that plunged 40% to $6.2 billion.
This comes even as Binance Japan formed a capital and business alliance with PayPay, a Softbank group company.
Softbank & PayPay invests 40% in Binance Japanhttps://t.co/To6pnzeTfm
— CZ 🔶 BNB (@cz_binance) October 9, 2025
PayPay and Binance aim to deliver a seamless financial experience for users in Japan by connecting cashless payments and digital assets.
“This strategic alliance represents a significant step toward the future of digital finance in Japan,” said Takeshi Chino, general manager for Binance Japan.
In other developments, Binance co-founder Changpeng Zhao, aka CZ, declared the start of a meme coin season on BNB Chain, with top tokens like Giggle and 4 soaring to new all-time highs (ATHs) yesterday.
#BNB meme szn! 😆
I didn’t expect this at all. And people keep asking me to predict the future… 🤷♂️
Keep building!
— CZ 🔶 BNB (@cz_binance) October 7, 2025
But the Binance Smart Chain (BSC) ecosystem saw corrected today, with the newly-popular meme coins retreating after a burst of speculative activity this week.
BNB memes are down across the board
Why?
– New Binance-native launchpad with $1M MCAP bonding curve
– Only accessible through Binance Wallet
– Launching on Meme Rush will become a heavy prerequisite for listing on AlphaBinance wants to control the volume
Link below 👇🏼 pic.twitter.com/jf8LfxS6gQ
— Elisa (@eeelistar) October 9, 2025
The fall comes after the space reported record monthly activity with more than 60 million active addresses and a $1 billion builder fund announcement that added to optimism earlier this month.
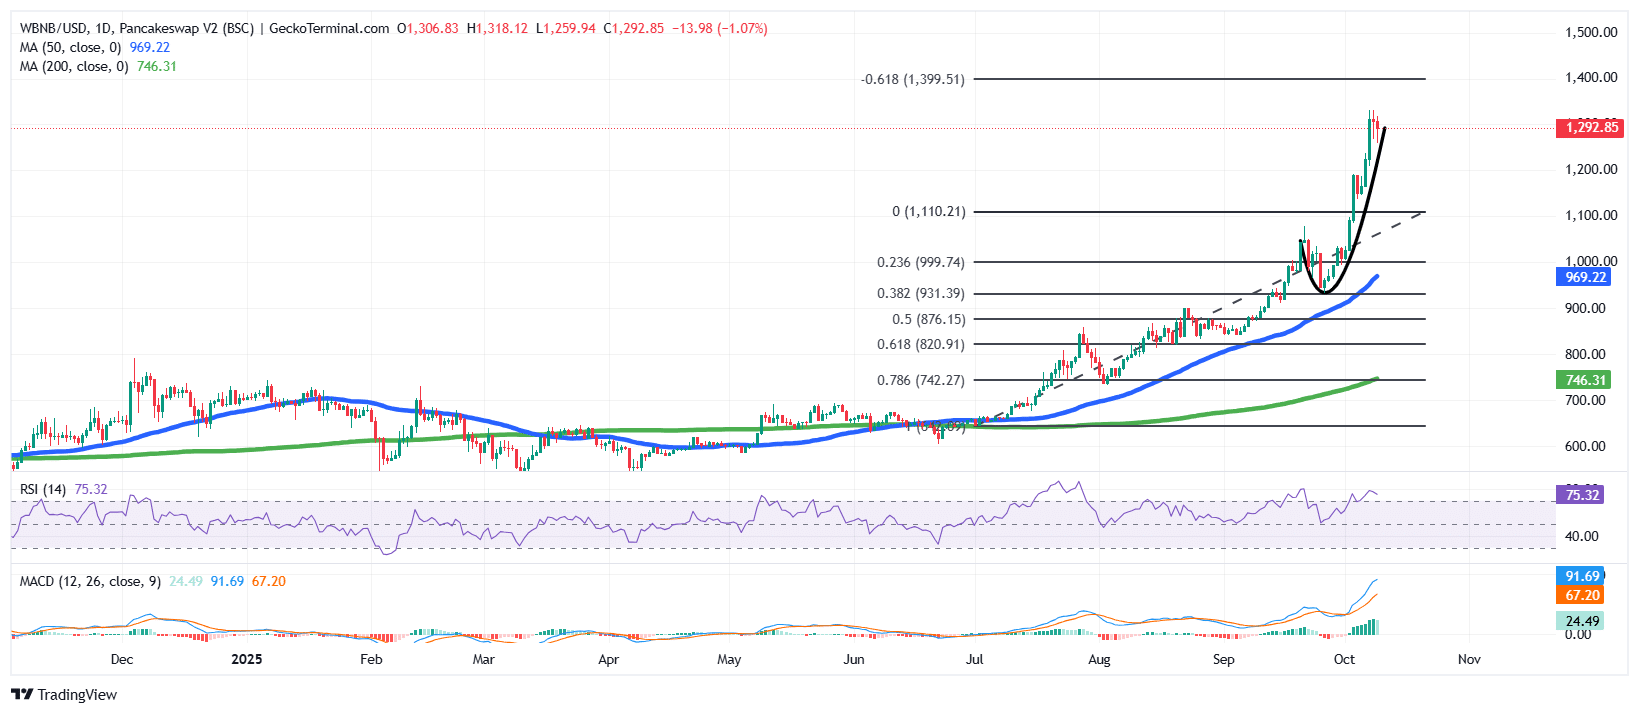
After hitting a new ATH at $1,330, the Binance Chain token has since dropped 4% from this level to lose its temporary ranking as the third-largest crypto to Tether. Can the BNB price recover?
Binance Price Eyes A Recovery Toward A Sustained Momentum
The BNB price on the daily chart reveals an impressive bullish uptrend, with the Binance Smart Chain token recently breaking above the $1,100 resistance and extending toward the $1,300 zone.
However, as the Binance Coin price action stretches further from the 50-day Simple Moving Average (SMA) (now at $969.22) and the 200-day SMA ($746.31), it indicates an overextended rally.
The Fibonacci retracement levels drawn from the recent swing low to high suggest potential retracement zones near $1,110 (0 level) and $999 (0.236 level). Should a correction occur, these areas may act as initial support zones before the next leg up. The slope of the 50-day SMA turning sharply upward further confirms a short-term bullish structure, but traders should be cautious as such steep moves often precede short-term profit-taking phases.


BSC Coin Price Momentum Indicators Confirm Strength
The Relative Strength Index (RSI) currently stands at 75.32, which signals overbought conditions. This suggests that while momentum remains strong, the market may be nearing exhaustion in the immediate term.
Meanwhile, the Moving Average Convergence Divergence (MACD) indicator reinforces the prevailing bullish sentiment. The blue MACD line has crossed well above the orange signal line, accompanied by a widening histogram that reflects increasing bullish momentum.
Given the current market setup, the price of BNB remains in a dominant uptrend, but short-term caution is warranted.
If the price of the Binance Coin maintains support above $1,100, the next bullish target lies near the Fibonacci extension at $1,400.
Conversely, a pullback toward $1,000 would not invalidate the broader bullish structure; it would likely serve as a healthy correction before the next advance.
Related News:
Best Wallet – Diversify Your Crypto Portfolio
- Easy to Use, Feature-Driven Crypto Wallet
- Get Early Access to Upcoming Token ICOs
- Multi-Chain, Multi-Wallet, Non-Custodial
- Now On App Store, Google Play
- Stake To Earn Native Token $BEST
- 250,000+ Monthly Active Users
Join Our Telegram channel to stay up to date on breaking news coverage


