

Join Our Telegram channel to stay up to date on breaking news coverage
The crypto market tumbled almost 2% in the last 24 hours as Bitcoin slid below the crucial $110,000 support level, initiating a massive sell-off across top digital assets, including Solana, Ethereum, and Dogecoin.
The Bitcoin price dropped to as low as $109,300 before recovering to trade at $110,329 as of 3:56 a.m. EST, with trading volume surging 13% to $54.3 billion.
SOL tumbled 5%, ETH dropped almost 4% and DOGE more than 4% in the last 24 hours.
FARTCOIN led the top losers with a 13.6% drop, followed by Curve DAO Token (CRV), Virtuals Protocol (VIRTUAL), and Chainlink (LINK), which dropped 8.2%, 7.8%, and 7.6%, respectively, according to CoinMarketCap data.
Over 180,000 traders were liquidated, with total liquidations coming in at $833.32 million, according to Coinglass.
The top gainer among major cryptos was Hyperliquid, which climbed 2.2%, followed by Cronos (CRO), Four (FORM), and UNUS SED LEO (LEO) with gains ranging from 1.3% to 0.7%.
Bitcoin Triggers Market-Wide Crypto Crash
Bitcoin dropped below the $110,000 level for the first time since early July, which triggered a market-wide swoon after a whale unloaded 24,000 BTC worth $2.7 billion on Sunday.
Crypto analyst Willy Woo, with over 1.2 million followers on X, says that BTC is rising so slowly this cycle because early whales with huge low-cost holdings are steadily selling, and it takes massive new capital inflows to absorb their supply.
Why is BTC moving up so slowly this cycle?
BTC supply is concentrated around OG whales who peaked their holdings in 2011 (orange and dark orange).
They bought their BTC at $10 or lower. It takes $110k+ of new capital to absorb each BTC they sell. pic.twitter.com/7CbWXsvX2l
— Willy Woo (@woonomic) August 24, 2025
BTC continues to show some bearish prospects. On the daily chart, the BTC price has broken below its 50-day Simple Moving Average (SMA) ($116,444), signaling weakness after failing to sustain its recent highs near $124,000.
BTC is now hovering around $110,000, with the Fibonacci 0.236 retracement at $112,350 acting as immediate resistance.
The Relative Strength Index (RSI) is currently at 38.9, indicating bearish momentum and edging toward oversold territory.
Meanwhile, the 200-day SMA at $100,768 remains a critical support level. If the price of Bitcoin holds above $110,000, it could attempt a bounce toward $112,350 and reclaim the 50-day MA.
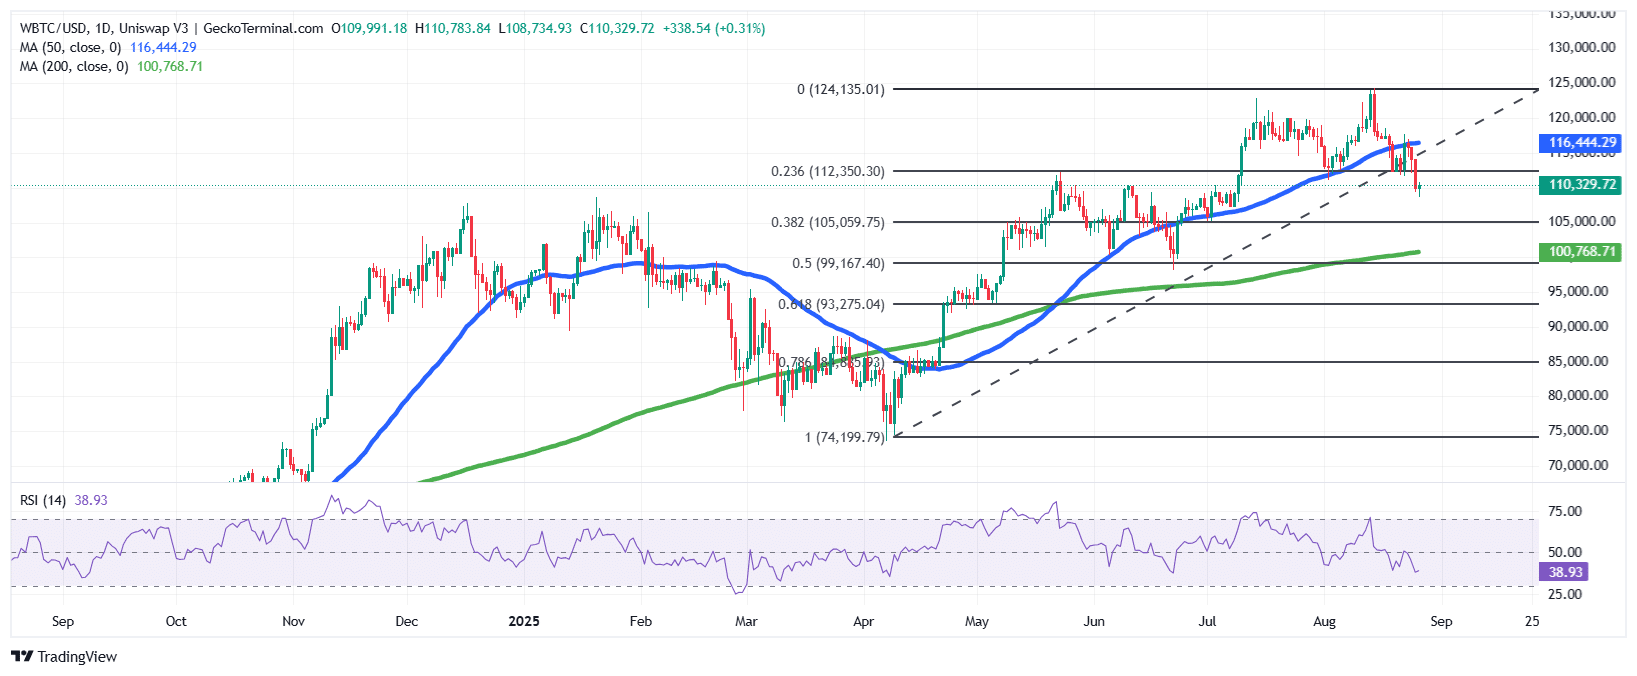
A failure to maintain current levels risks a slide to $105,000 and potentially $99,000, where the 0.382–0.5 Fibonacci zone aligns with prior demand.
Peter Schiff is predicting a fall to as low as $75,000, and says that investors should sell now and buy back lower.
Bitcoin just dropped below $109K, down 13% from its high less than two weeks ago. Given all the hype and corporate buying, this weakness should be cause for concern. At a minimum, a decline to about $75K is in play, just below $MSTR‘s average cost. Sell now and buy back lower.
— Peter Schiff (@PeterSchiff) August 26, 2025
However, on August 25, BTC spot ETFs (exchange-traded funds) recorded over $219 million in net inflows, according to Coinglass.
Billionaire investor Tim Draper remains bullish, reiterating his $250k price target.
🇺🇸 BILLIONAIRE TIM DRAPER JUST SAID LIVE ON CNBC THAT THIS IS THE BEST TIME TO BUY #BITCOIN
HERE WE GO!!! pic.twitter.com/frwN3HwUPj
— Vivek Sen (@Vivek4real_) August 25, 2025
Ethereum Remains Bullish Despite Recent Drop
Despite the broader market decline, Ethereum trades at $4,418 within a rising channel pattern.
After pulling back from a high near $4,800, the ETH price remains above the channel’s midline, with the 50-day SMA at $3,836 providing dynamic support and the 200-day SMA at $2,633 reinforcing a long-term bullish structure.
Meanwhile, the RSI sits at 54.6, showing healthy momentum without being overbought.
As long as ETH stays above $3,800, continuation toward $4,800 and possibly $5,000 remains likely. A breakdown below $3,800 could trigger a test of $3,200, but the prevailing bias remains bullish within the channel.
Positive social media sentiment observed by popular trader Ali Martinez may drive further interest and Fundstrat managing partner Tom Lee said that ETH has bottomed out after the recent pullback to around $4,300.
Mark @MarkNewtonCMT again at it.
➡️Calling ETH bottom to happen in next few hours
Tickers: $BMNR $GRNY pic.twitter.com/038efU7cZH
— Thomas (Tom) Lee (not drummer) FSInsight.com (@fundstrat) August 26, 2025
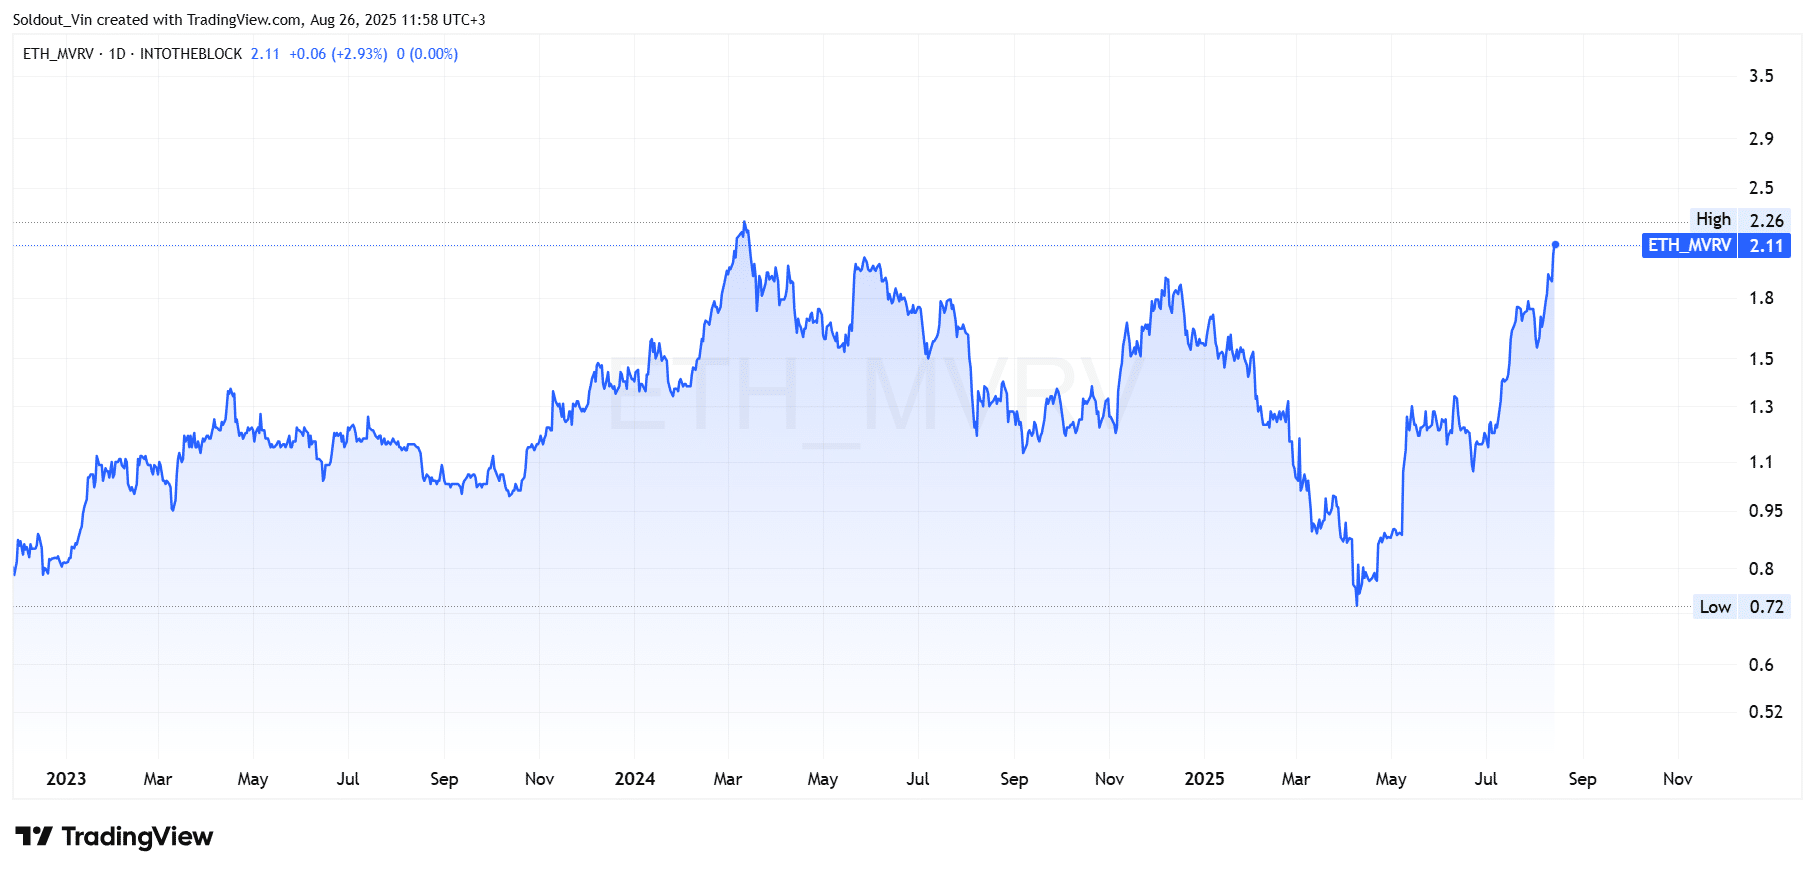
However, according to TradingView data, Ethereum’s MVRV ratio is now 2.11, which shows that most holders are up more than 2X on average, a level which often results in volatility and profit-taking.
Solana And Dogecoin Show Mixed Signals
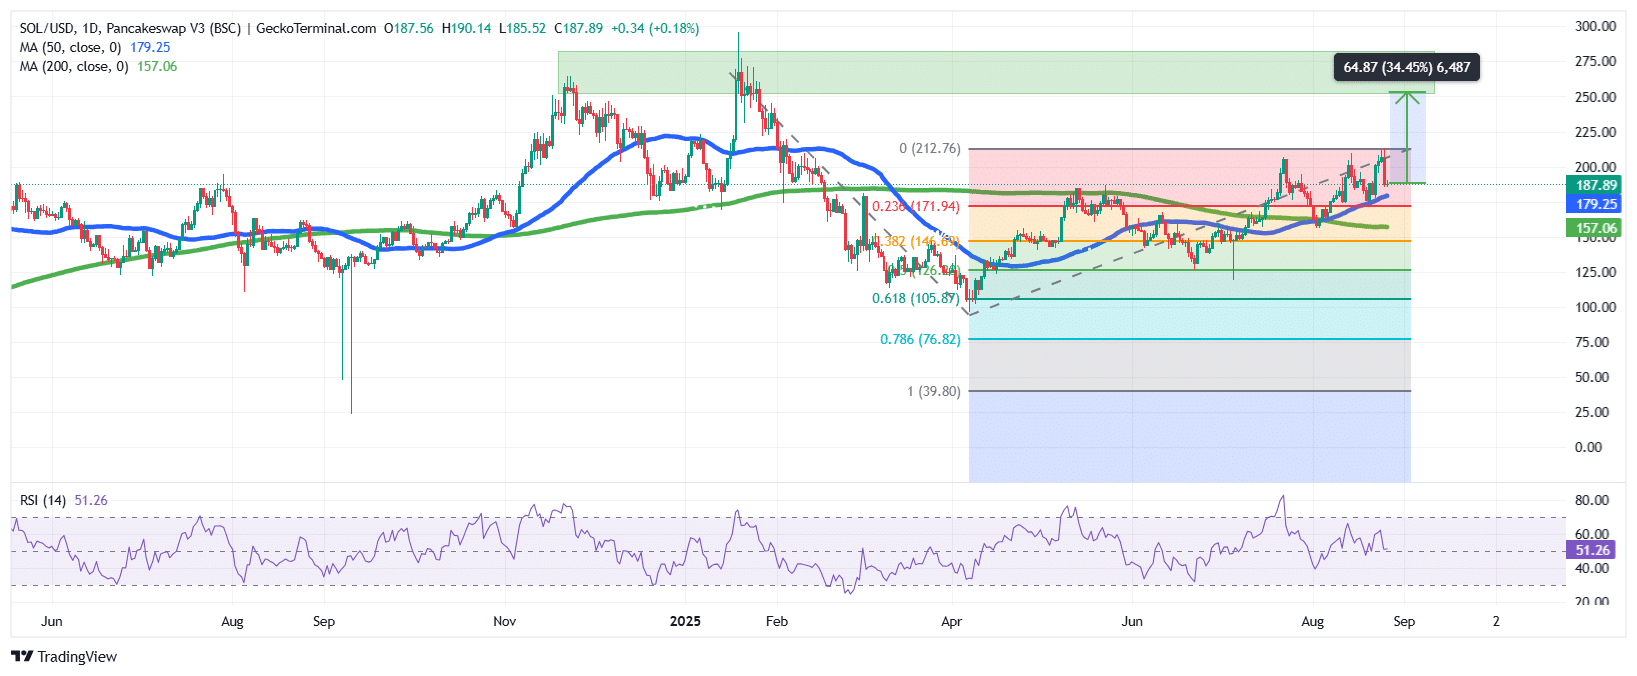
Solana is currently trading at $187.89, with trading volume down 26% to $9.7 billion. SOL is bullish, trading above both the 50-day and 200-day SMAs with neutral RSI at 51.
The Solana price has cleared key resistance and could target $250 if momentum holds, while $170 remains strong support.
According to REX Financial CEO Greg King, Solana may be the future platform for stablecoins.
“Solana is faster (than eth).. frankly when i saw the big debate about stable coins all being built on Eth I was like this is a huge oversight. I think Solana is the story for the future as far as stable coins go” – Greg King on IQ today 🔥 https://t.co/jpIZJ0BMjS
— Eric Balchunas (@EricBalchunas) August 25, 2025
A popular crypto analyst on X called Pentoshi said SOL could be headed for the $250 zone, despite the recent downtrend.
Meanwhile, top memecoin Dogecoin is consolidating in a symmetrical triangle, squeezed between $0.25 resistance and $0.20 support, as it currently trades at $0.2105.
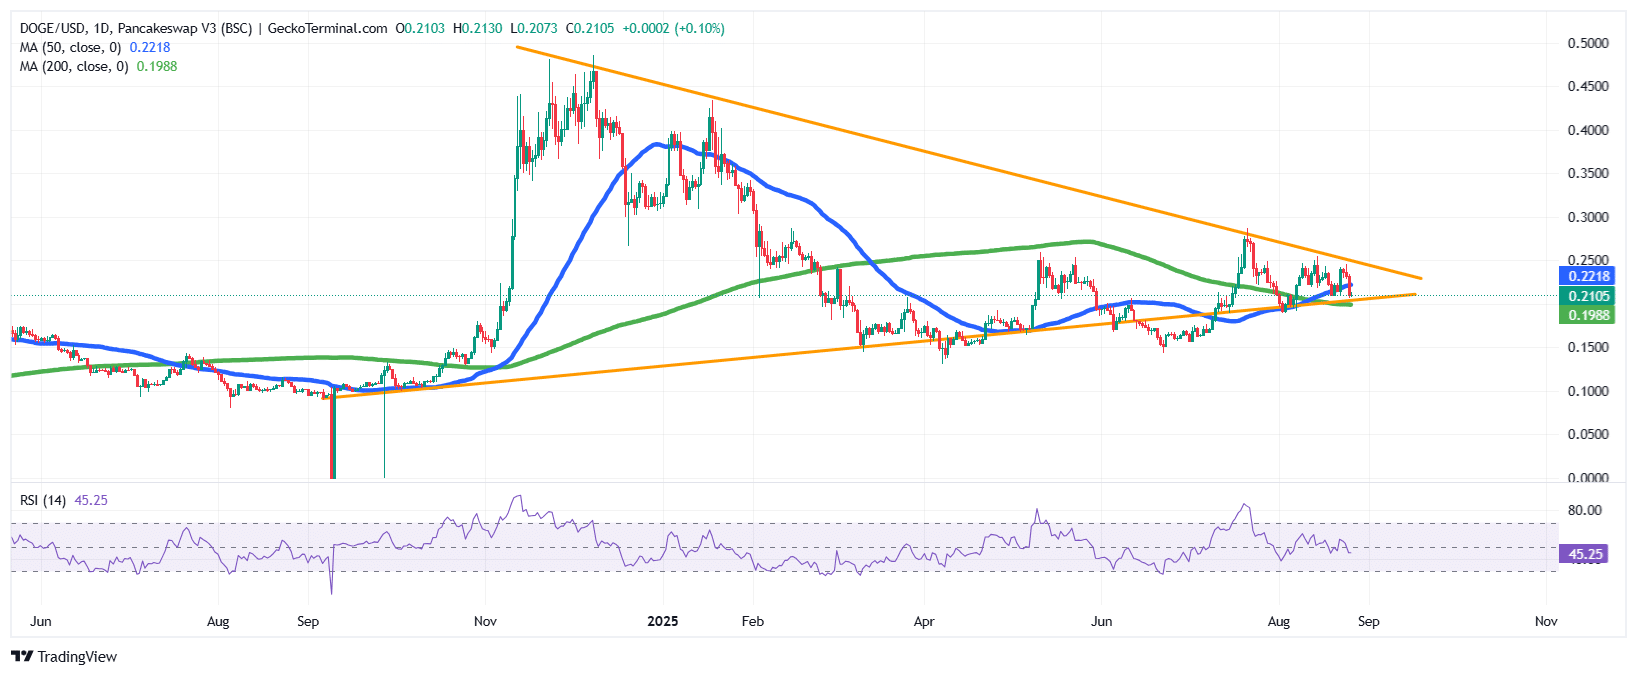
The RSI at 45 shows indecision. A breakout could push it toward $0.30–$0.35, while a breakdown risks $0.17.
Related News:
Best Wallet – Diversify Your Crypto Portfolio

- Easy to Use, Feature-Driven Crypto Wallet
- Get Early Access to Upcoming Token ICOs
- Multi-Chain, Multi-Wallet, Non-Custodial
- Now On App Store, Google Play
- Stake To Earn Native Token $BEST
- 250,000+ Monthly Active Users
Join Our Telegram channel to stay up to date on breaking news coverage