

One of the challenges that comes from analyzing markets and the economy is just how much “gray” there is. Most data points exist along a noisy continuum, subject to future revisions. The meanderings above or below the trend may be just noise, or the start of something more ominous. Key reversals occur rarely and are difficult to spot in real time.
Add to this the fact that markets are far less correlated to the economy than most people believe. We impose our desire for order and clear causation, which leads us to imagine we understand the present with far greater clarity than our history suggests (to say nothing of the future).
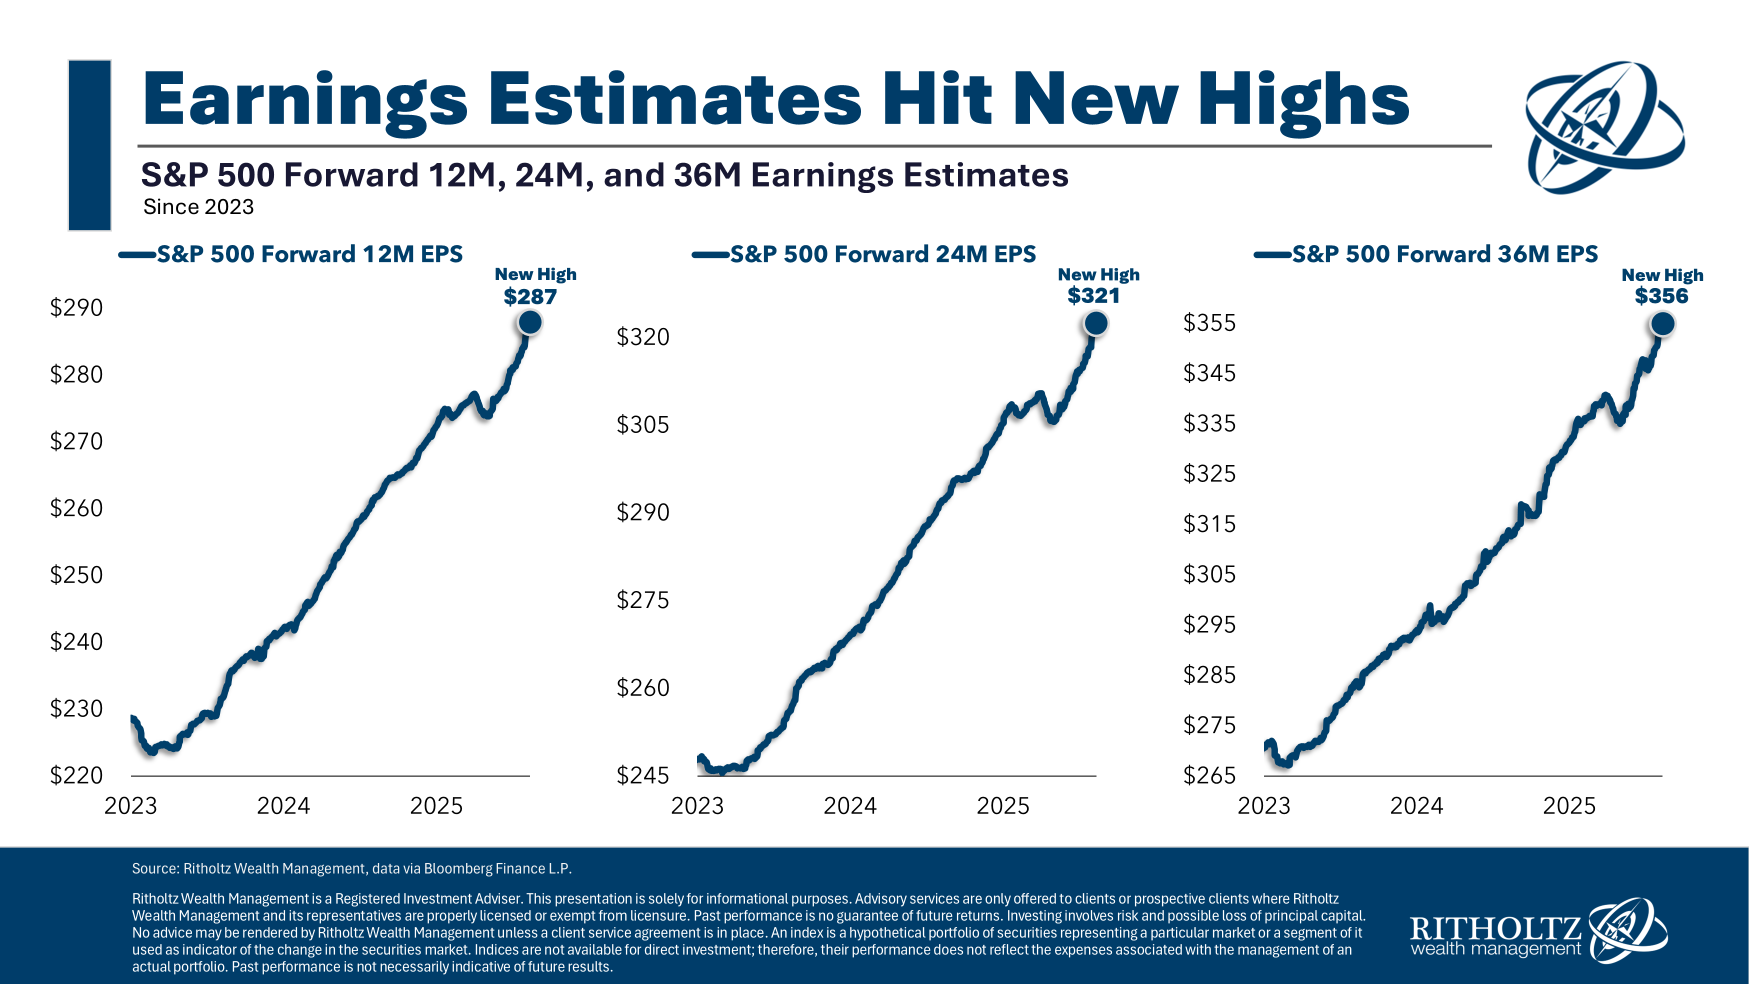
The past few months exemplify this: consumer sentiment is janky, yet consumer spending remains robust. The labor market is less tight than before, but wages have increased, even as unemployment stays low. Corporate profits are at record highs, and expectations are for continued growth.
Tariffs are the wild card.
So far, companies have absorbed most of the tariff costs but are expected to start passing those costs on to consumers. Yes, tariffs are a consumption tax, and at least until now, they have had a relatively mild effect on spending. It’s still early in the Trump 2.0 tariff regime, and they are likely to create a headwind for future consumer spending.
Then, there is the V.O.S. Selections, Inc. v. Trump, which I discussed in July. I remain surprised at how little coverage this case has received, considering its potential to overturn ALL of the 2.0 tariffs. If that were to occur, it would be a bullish surprise. (We will discuss this more in the future if necessary).
Last, there are the underlying technicals of the market: There seems to be endless liquidity, and markets have shaken off every bit of bad news. (I am more interested in the reaction to the news than the news itself).
How much are these crosscurrents – consumer spending, labor, rate cuts, inflation, tariff policy, etc. – already reflected in stock prices? Considering that we are currently trading at all-time highs, the assumption is that the markets are already discounting a lot of the bad news.
Historically, secular bull markets can run much longer, further, and higher than most observers expect. The long bull runs of 1982-2000 and 1946-1966 are prime examples. This secular bull run began in March 2013, when just about every market broke out over its prior trading range. At 12 years old, it could still have a goodly number of years left to run. The giant Covid-19 fiscal stimulus continues to be a tailwind, even if it was a major source of inflation from 2020 to 2023. I have no idea how that “reset” affects market longevity, but I suspect it is a significant factor.
So far, markets have climbed the wall of worry in 2025. The open question is how much prices have incorporated big upside or downside surprises.
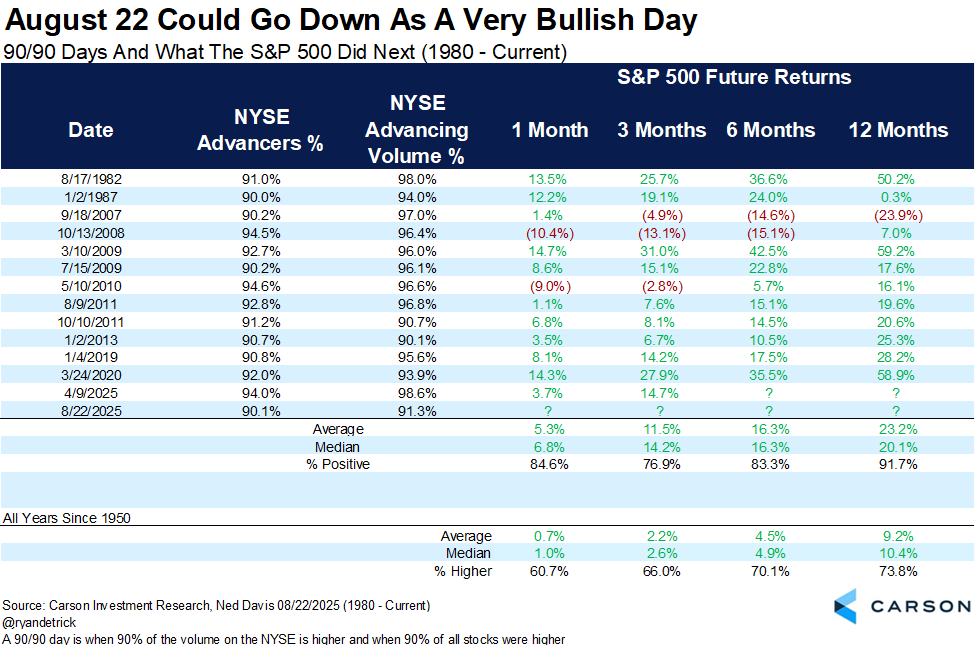
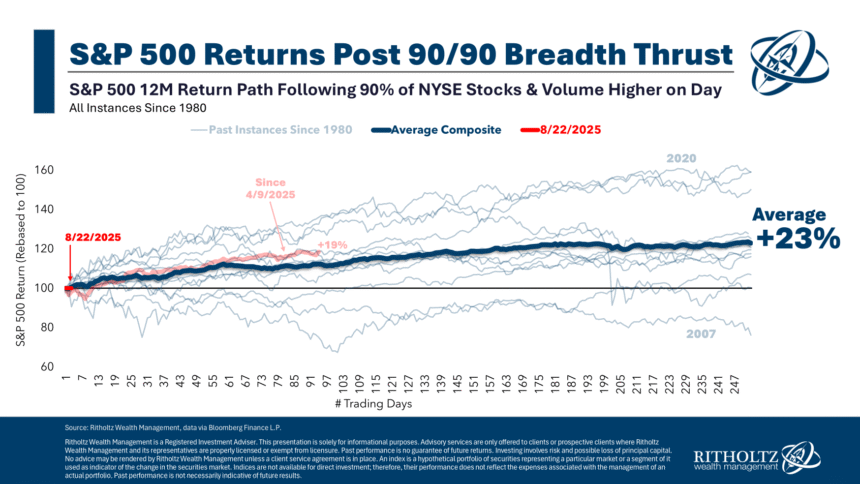
Consider the thrust chart up top (table below).
When we see days like these, where 90% of the volume on the NYSE is higher, and 90% of all stocks are in the green, it tends to be bullish for the next 12 months of gains. The last 90/90 day was April 9th of this year, when we had a 90-day pause on Tariffs. The S&P 500 is up 29.8% since then; the Nasdaq 100 has gained 37.5%.
Since 1982, we have seen one negative, one flattish, and 12 positive sets of returns over the 12 months that followed a 90/90 day. It’s not a guarantee, but it suggests favorable odds for remaining constructive.
See Also:
Cars, coffee and clothing are poised to get pricier with new tariffs (Washington Post, August 8 2025)
Will US inflation data support investor hopes of a rate cut? (Financial Times, August 24, 2025)
How Long Can This Uncanny Stock Market Prosper? (New York Times, August 22, 2025)
Previously:
Might Tariffs Get “Overturned”? (July 31, 2025)
Are Tariffs a New US VAT Tax? (March 31, 2025)
What Is Driving Inflation? (July 29, 2025)
All Time Highs Are Bullish (June 26, 2025)
A Spectacularly Underappreciated 15 Years (April 28, 2025)
NFP Disappoint; Revisions Worse (August 1, 2025)
7 Increasing Probabilities of Error (February 24, 2025)