

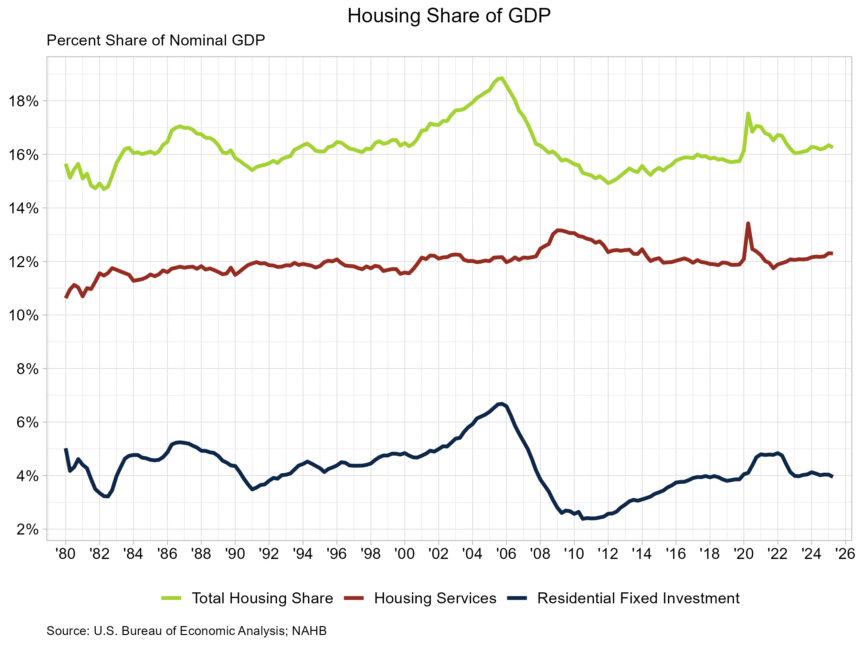
Housing’s share of the economy registered 16.3% in the second quarter of 2025, according to the advance estimate of GDP produced by the Bureau of Economic Analysis. This reading is unchanged from a revised level of 16.3% in the first quarter and is the same as the share one year ago.
The more cyclical home building and remodeling component – residential fixed investment (RFI) – was 4.0% of GDP, level from 4.0% in the previous quarter. The second component – housing services – was 12.3% of GDP, also unchanged from the previous quarter. The graph below plots the nominal shares for housing services and RFI along with housing’s total share of GDP.

Housing service growth is much less volatile when compared to RFI due to the cyclical nature of RFI. Historically, RFI has averaged roughly 5% of GDP, while housing services have averaged between 12% and 13%, for a combined 17% to 18% of GDP. These shares tend to vary over the business cycle. However, the housing share of GDP lagged during the post-Great Recession period due to underbuilding, particularly for the single-family sector.

In the second quarter, RFI subtracted 19 basis points to the headline GDP growth rate, marking the second straight quarter of negative contributions. RFI was 4.0% of the economy, recording a $1.2 trillion seasonally adjusted annual pace. Among the two segments of RFI, private investment in structures shrunk 4.5%, while residential equipment fell 7.9%.

Breaking down the components of residential structures, single-family RFI fell 12.9%, while multifamily RFI fell 1.3%. RFI for multifamily structures has contracted for eight consecutive quarters. Permanent site structure RFI, which is made up of single-family and multifamily RFI, fell 10.2%. The other structures RFI category rose 0.6% in the second quarter.

The second impact of housing on GDP is the measure of housing services. Similar to the RFI, housing services consumption can be broken out into two components. The first component, housing, includes gross rents paid by renters, owners’ imputed rent (an estimate of how much it would cost to rent owner-occupied units), rental value of farm dwellings, and group housing. The inclusion of owners’ imputed rent is necessary from a national income accounting approach, because without this measure, increases in homeownership would result in declines in GDP. The second component, household utilities, is composed of consumption expenditures on water supply, sanitation, electricity, and gas.
For the second quarter, housing services represented 12.3% of the economy or $3.7 trillion on a seasonally adjusted annual basis. Housing services expenditures fell 0.2% at an annual rate in the second quarter. Real personal consumption expenditures for housing grew 1.2%, while household utilities expenditures fell 9.2%.
Personal consumption expenditures (PCE) for housing services are the largest component of PCE, making up 18.1% in the second quarter. The second largest component of PCE is health care services, at 17.0%. Expenditures on services totaled $14.2 trillion on a seasonally adjusted annual basis in the second quarter, more than double expenditures on goods ($6.4 trillion).

Discover more from Eye On Housing
Subscribe to get the latest posts sent to your email.