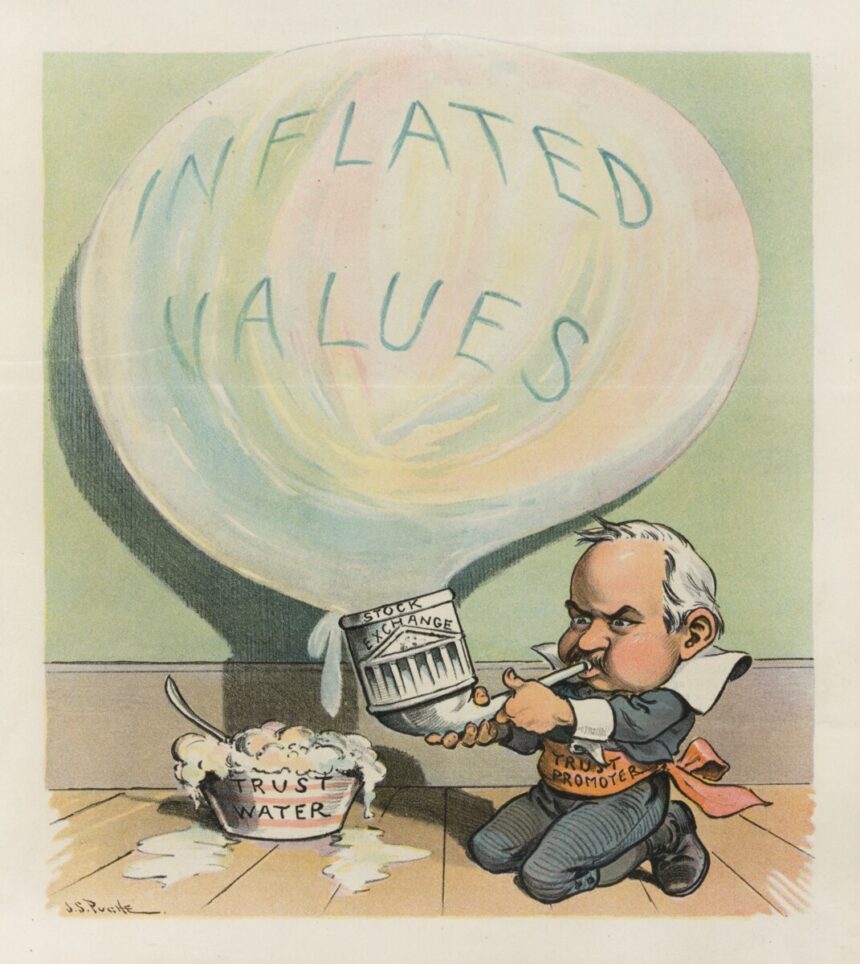
My contrarian instincts often kick in when I see the crowd reaching a questionable consensus. Most of the time, what the crowd does IS the market; what they say, however, is often suspect.
Over the past few years, the crowd has expected rapid Federal Reserve rate cuts that never materialized; there were repeated expectations in 2022, ’23, and ‘24 of an imminent recession that never happened; the fears caused by market concentration seem to have also been ignored by Mr. Market.
Then there is the endless cacophony of bubble chatter.
I cannot recall ever hearing the crowd identify a bubble in real time, and then there actually a) being a bubble that b) burst soon after. By definition, the crowd creates bubbles through a combination of psychology, greed/FOMO, excess liquidity, and sheer recklessness.
Way back in 2011, I tried to create a checklist of how to spot a bubble in real-time. With the benefit of time and hindsight, it is easy to see the influence of the Great Financial Crisis on that list. It is 14 bullet quantitative points that should allow you to see if any market is exhibiting bubblicious tendencies.
Let’s go through those 14 points to see how they hold up today:
Standard Deviations of Valuation: Markets are pricey, but not Japan 1989/1999-2000 Dotcom pricey
Significantly elevated returns: The past 15 years have seen returns of 16% annually. This is the third-best rolling 15-year period since WW2, but it also follows a 57% GFC crash. The past two years 25% annually. 2023-24 certainly counts as elevated.
Excess leverage: While there are some leveraged products put there like 2X and 3X ETFs, it is hardly a meaningful amount of capital (the same was said about Subprime, but that was wildly infiltrated throughout the entirety of the financial system)
New financial products: Alts? Private Credit? Neither is so much “New” as newly popular.
Expansion of Credit: Mostly tight, not very available.
Trading Volumes Spike: NYSE average daily trading volume (ADV) is roughly 1.36 billion shares – somewhat above historical average of 900 million to 1.2 billion shares per day. NASDAQ average daily volumes has exceeded 9 billion shares through 2025. ADV ranges 6–8 billion shares daily, so activity this year is well above average.
Perverse Incentives: I am not aware of much here other than the land grab in alts, the huge number of new ETFs, and the return of meme stock trading.
Tortured rationalizations: These are ever-present, but there has been some uptick lately.
Unintended Consequences: Have yet to fully happen.
Employment trends: Full employment is offset by eye-watering salaries for AI engineers.
Credit Spreads: Are very tight, and make me wonder why anyone would want to own HY when IG is almost the same pricing
Credit Standards: Still tight since the GFC.
Default Rates: Low, but moving higher in autos, credit card, mortgage but especially student loan debt.
Unusually Low Volatility: VIX atr 20 is not exactly complacent; as we saw in April, VOL has been quick to respond to any issue…
So while there are some signs of bubblicious activity, it is hardly overwhelming or seriously determinative in my view. Stocks are pricey, but this seems less like a bubble and more like a later stage bull market cycle.
Earlier this year, I noted what a spectacularly underappreciated 15 years we have enjoyed. The bubble talk looks like a lot more of the same…
Remember, Greenspan’s “Irrational Exuberance” speech was December, 1996. All bull markets run further, longer, and higher than most expect…
Previously:
Checklist: How to Spot a Bubble in Real Time (June 9, 2011)
A Spectacularly Underappreciated 15 Years (April 28, 2025)
Realtime Bubble Checklist
1. Standard Deviations of Valuation: Look at traditional metrics – valuations, P/E, price to sales, etc. — to rise two or even three standard deviations away from the historical mean.
2. Significantly elevated returns: The S&P500 returns in the 1990s were far beyond what one could reasonably expect on a sustainable basis. The years around Greenspan’s “Irrational Exuberance” speech suggest that a bubble was forming:
1995 37.58
1996 22.96
1997 33.36
1998 28.58
1999 21.04
And the Nasdaq numbers were even better.
3. Excess leverage: Every great financial bubble has at its root easy money and rampant speculation. Find the leverage, and speculation won’t be too far behind.
4. New financial products: This is not a sufficient condition for bubble, but it does seems that each major bubble has new products somewhere in the mix. It may be Index funds, derivatives, tulips, 2/28 Arms.
5. Expansion of Credit: This is beyond mere speculative leverage. With lots of money floating around, we eventually get around to funding the public to help inflate the bubble. From Credit cards to HELOCs, the 20th century was when the public was invited to leverage up.
6. Trading Volumes Spike: We saw it in equities, we saw it in derivatives, and we’ve seen it in houses: The transaction volumes in every major boom and bust, almost by definition, rises dramatically.
7. Perverse Incentives: Where you have unaligned incentives between corporate employees and shareholders, you get perverse results — like 300 mortgage companies blowing themselves up.
8. Tortured rationalizations: Look for absurd explanations for the new paradigm: Price to Clicks ratio, aggregating eyeballs, Dow 36,000.
9. Unintended Consequences: All legislation has unexpected and unwanted side effects. What recent (or not so recent) laws may have created an unexpected and bizarre result?
10. Employment trends: A big increase in a given field — real estate brokers, day traders, etc. — may be a clue as to a developing bubble.
11. Credit Spreads: Look for a very low spread between legitimately AAA bonds and higher yielding junk can be indicative of fixed income risk appetites running too hot.
12. Credit Standards: Low and falling lending standards are always a forward indicator of credit trouble ahead. This can be part of a bubble psychology.
13. Default Rates: Very low default rates on corporate and high yield bonds can indicates the ease with which even poorly run companies can refinance. This suggests excess liquidity, and creates false sense of security.
14. Unusually Low Volatility: Low equity volatility readings over an extended period indicates equity investor complacency.


